
Browse your stats
![]()
Urungi is meant to be used by people who do not know – or can not – do SQL queries, but need to create tables and reports. Urungi is released under GNU / GPL
Download from https://urungi.org/
Talk about Urungi
To achieve his goal, Urungi uses three concepts :
- the data source
- the layer: the “view” that defines what can be used in reports; this step is critical: a well constructed layer can then easily generate any report and dashboard
- reports / dashboards, which are based on one or more layers.
Connecting to a database
Before building our dashboards, you have to connect to a database. Urungi offers connectors to MariaDB, PostgreSQL, MSSQL and Oracle. A connector to mongoDB is also available, but at this time it no longer works; we disabled it.
Creating layers
A layer is an intermediate stratum between the database and the end user. It can be seen as a view. A computer scientist (usually) will build one (or more) layers, which will then allow the end user to build his reports, charts and dashboards.
A layer contains:
- Base fields (from any table in the database) each field has its Urungi label and some additional parameters such as format, default grouping, type (numeric, alphabetical);
- folders: we can group the fields in functionally coherent blocks, to organize the view; for example, in a “supplier, order, order line, product” database, one could have a “Supplier” folder and a “Order” group; we can have subfolders on as many levels as we want, the one who builds the layer can organize things as he wishes;
- computed fields: these are fields that are not directly derived from the database, but calculated from its fields, the available formulas are those of the underlying database – for example, if we have a field date_cmde, we can create a YEAR (date_cmde).
Création de rapports
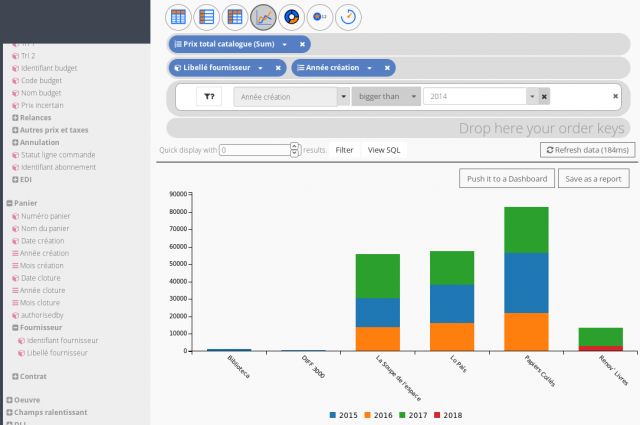
Urungi allows the creation of lists, tables, graphs in a few clicks, once your layer is defined.
Depending on the type of report to create, simply drag and drop the fields you want to report on, specify some additional parameters, click “Refresh”, and you have a first draft of your report (calculated by default on the five hundred first data returned by the database).
It is also possible to:
- define parameters to be selected when the report is run;
-
publish the report to make it accessible to other users of Urungi (and soon make it public)
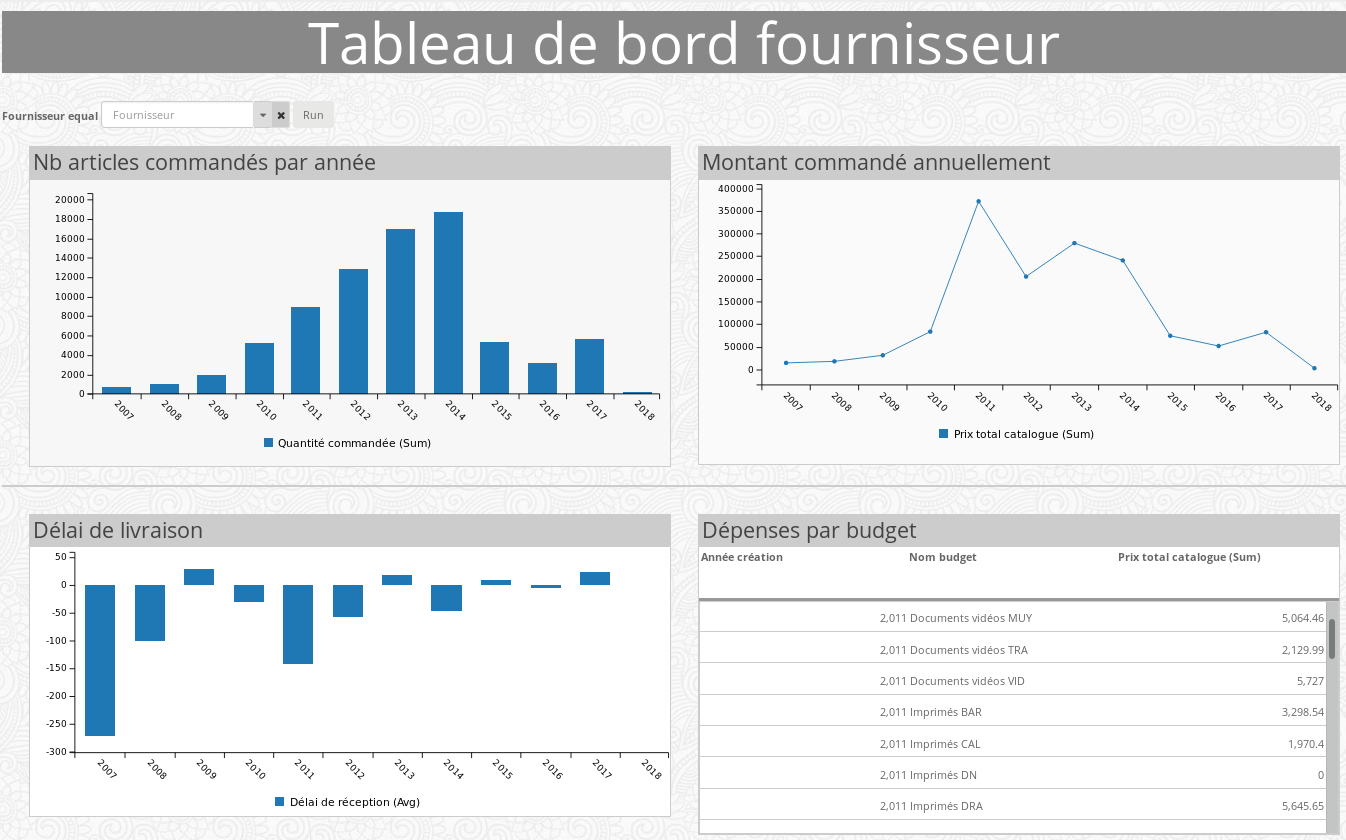
Creating dashboards
Urungi allows you to define dashboards with several reports, with a free layout. The system is already very flexible and will be further improved in the coming months. A mechanism of “boxes” define the lines of your dashboard. Each line has one, two, three or four boxes, which can in turn contain sub-boxes. In each box, text, a report, an image, etc. Everything is editable, it’s HTML with a graphic overlay.

Import and export
It is possible to export (in JSON) layers, reports and dashboards, which makes it easy to deploy batches to users with multiple needs.
Urungi at BibLibre
In the case of BibLibre: our customers (around 200) are exclusively libraries, which use software that we have deployed at home. The needs are very similar from one institution to another. We have an internal instance on which we create our reports, just an export and import, and we deploy very simply !
That’s why we offer our Koha customers a packaged version of Urungi.
